Recent Posts

Sat May 13 2023

Reverse Engineering Netpanzer and Extracting Assets

Article size is 15.5 kB and is a 10 min read

A free game I used to love to play around 2006 was NetPanzer. The only machines I had access to were free Pentium III machines, which I threw Linux on, so that kinda limited me to games like NetPanzer and WolfET.

This was also the game where, in my young youth, learned through the chat feature how much people hated Americans :)

Recently I'd been fixing bugs and stuff in WolfET (a little in 2014, and then again recently), and wondered what was up with NetPanzer.

The Current State of Things

The game, today, does not run. If you install NetPanzer from your repo's package manager and start it, it will crash.

If you run it from the shell, you'll see that's because it can't reach the master server, and then it segfaults.

netpanzer.info is no longer online in 2023. I found an archived forum post from 2019 of a maintainer asking for help with the project. It seems soon after, when nobody replied, the project slowly died and went offline.

UPDATE May 9th: It seems after bugging the maintainer, about a month later, netpanzer.info is back online, and they restored the master server. So you can play NetPanzer again! I am also working with the maintainer to run a second master serer. I've already thrown up one 0.8.x dedicated server that supports up to 100 players.

A New Map Builder?

One of the issues with the existing game is that, while you can run your own server, you can't create new maps.

The map building tool is long gone, and the asset storage is not immediately obvious. So how do we go about fixing that? Custom maps allow people to mod the game.

One idea I've been floating around is adding the ability to build and import maps from an existing popular tool. So let's see if we can figure out how the game assets are managed.

Extracting The Assets

The first assets that are easy to extract are the game flags and icons, which are in BMP format. This gave an early clue as to how the game assets are stored elsewhere - as raw, uncompressed, bitmaps.

We find some interesting files in a wads folder:

  • wads/netp.act
  • wads/netpmenu.act
  • wads/summar12mb.tls

... and in units/pics/pak we find many files ending in .pak files, with the unit names (like ArchHNSD.pak).

Games of this era commonly stored the assets in ".pak" files, but they all used their own format, the exception being IDTech 3 engine games (like WolfET) which all used the same format designed by John Carmack.

NetPanzer is not an IDTech 3 game, and uses a custom binary format.

So let's reverse engineer the pak files.

The Different File Types

There are a few binary formats.

The .pak files are purely a header in binary, with the bitmap image data after.

To read the files, we simply seek through X number of bytes at a time:

const unit_contents = fs.readFileSync('units/pics/pak/TitaHNSD.pak');
const unit_buffer = SmartBuffer.fromBuffer(unit_contents);
console.log('unit version', unit_buffer.readInt32LE());
console.log('unit x', unit_buffer.readInt32LE());
console.log('unit y', unit_buffer.readInt32LE());
console.log('unit frame_count', unit_buffer.readInt32LE());
console.log('unit fps', unit_buffer.readInt32LE());
console.log('offset_x', unit_buffer.readInt32LE());
console.log('offset_y', unit_buffer.readInt32LE());

Whereas, the unit metadata is stored in /profiles as text:

hitpoints =  120;
attack =  350;
reload =  110;
range =  48;
regen =  90;
defend_range =  119;
speed_rate =  16;
speed_factor =  2;
image =  "pics/menus/vehicleSelectionView/archer.bmp"
bodysprite =  "units/pics/pak/ArchHNSD.pak"
bodyshadow =  "units/pics/pak/ArchHSSD.pak"
turretsprite =  "units/pics/pak/ArchTNSD.pak"
turretshadow =  "units/pics/pak/ArchTSSD.pak"
soundselected =  "mu-selected"
soundfire =  "mu-fire"
weapon =  "DOUBLEMISSILE"
boundbox =  40

So what about the .act and .tls files?

Well, the .act files are color palettes. It turns out that the pak files, and the .tls files, simply store offsets into the .act files. The reduces the amount of data stored in each map and unit file. We simply store the colors once, and can use a single 8 bit integer to index into one of the 256 colors to save disk space.

Extracting Game Units

Extracting the game unit assets was quite easy. A bit of time was spent doing this myself, and then I found a file called pak2bmp.cpp in the original code

First was to figure out the build system, which uses scons. scons uses a Python file to define the build process, like so:

def globSources(localenv, sourcePrefix, sourceDirs, pattern):
    sources = []
    sourceDirs = Split(sourceDirs)
    for d in sourceDirs:
        sources.append(glob.glob( sourcePrefix + '/' + d + '/' + pattern))
    sources = Flatten(sources)
    targetsources = []
    for s in sources:
        targetsources.append(buildpath + s)

    return targetsources

The build script is a ~280 line Python script. After installing scons the build promptly fails with print not found - as the file was written for Python 2. Luckily converting it to Python 3 was quite easy, so onward...

I have no idea how to change the default build target with scons to just build our pak2bmp.cpp tool. Eventually I realized I can just change the default in the SContruct file:

pak2bmp = env.Program( binpath+'pak2bmp'+exeappend, 'support/tools/pak2bmp.cpp')
Alias('pak2bmp',pak2bmp)

bmp2pak = env.Program( binpath+'bmp2pak'+exeappend, 'support/tools/bmp2pak.cpp')
Alias('bmp2pak',bmp2pak)

Default(map2bmp)

This worked, however I ran into compilation issues with how the codebase was extending std::exception for the networking layer (I would later fix this, but that's for a separate post).

Eventually I decided - we don't need Networking - so after learning scons some more I simply omitted all the networking code from the build.

$ ./pak2bmp 
pak2bmp for NetPanzer V 1.1
use: ./pak2bmp <filename> <output_folder> [palette_file_optional]
note: if using palette file, use only the name without extension or path
note2: even on windows the path must be separated by '/'
note3: YOU have to create the output directory
example for using palete (default is netp):
./pak2bmp units/pics/pak/TitaHNSD.pak titan_body netp

Success!

We can now extract all the unit assets with a little script:

ls units/pics/pak | xargs -i sh -c 'mkdir ./bmp/units/pics/{}'
ls units/pics/pak/ | xargs -i sh -c './pak2bmp units/pics/pak/{} ./bmp/units/pics/{}/'

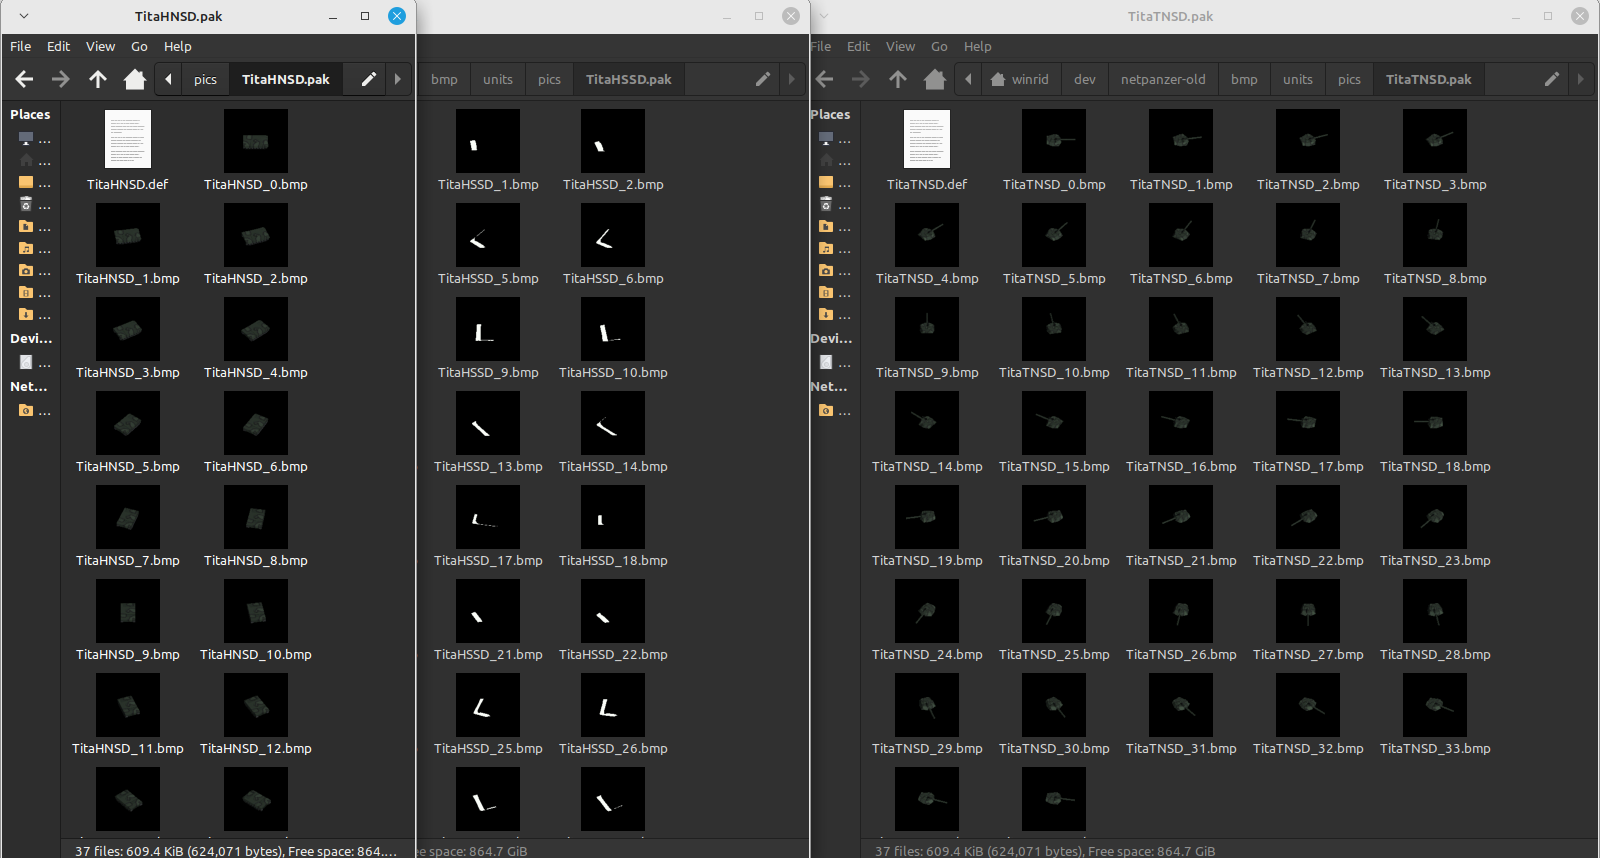
The unit assets are split up into three categories for each unit:

  • The unit body, with a frame for each rotation.
  • The unit turret, with a frame for each rotation.
  • The unit shadow, again with many frames.

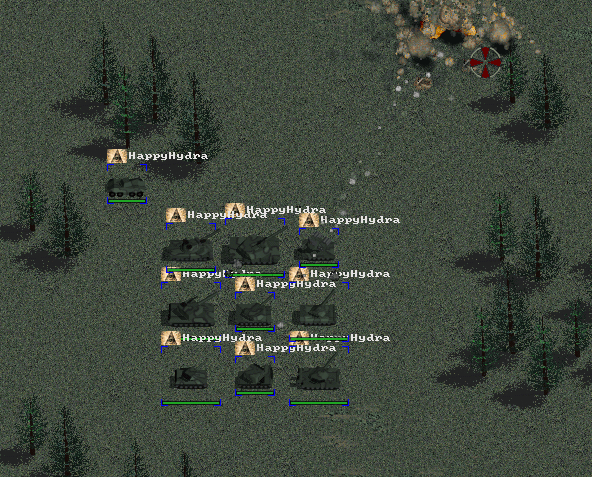
So while in game they look like:

They are actually stored like:

Extracting Game Map

Map data. This is the hard part. There is no "dump the map data" script.

It turns out the actual tile images are stored in summer12mb.tls. As you could guess, this is a 12mb file. The actual maps are quite small, because they are just pointers into offsets into this file.

It's quite a bit more complicated than that, however. I was hoping I could just get a list of bytes, after figuring out the pointers into the palette, and dump it to a bit bitmap file for each map, and then convert this file to another more modern format.

It was not going to be quite this simple. :)

The map data is split across a few structures.

First, the .tls file itself starts with:

class TILE_DBASE_HEADER
{
public:
    unsigned char    netp_id_header[64];
    unsigned short    version;
    unsigned short    x_pix;
    unsigned short    y_pix;
    unsigned short    tile_count;
    unsigned char    palette[768];
}

The map tiles also have a list of this structure, which stores the move_value (how fast a unit can move, if at all. The game uses A*):

class TILE_HEADER
{
public:
    char    attrib;
    char    move_value;
    char    avg_color;
}

...and finally a uint8 of map_data.

Eventually I figured out how the game loads and renders maps, so I could stop reverse engineering the structure and create my own map2bmp.cpp:

First, we need to "start the map loading", which takes a map name, whether or not to load the map tiles, and the number of partitions to load it into:

MapInterface::startMapLoad(filename.c_str(), true, 1);

Then there is a function we are supposed to repeatedly call to load the map, which takes a pointer to an integer that is updated to track the progress:

int percent_complete;
char strbuf[256];

while( MapInterface::loadMap( &percent_complete ) == true ) {
    sprintf( strbuf, "Loading Game Data ... (%d%%)", percent_complete);
}

printf("Map loaded!\n");

Now let's create an SDL1 Surface to write the map to:

int total_width = MapInterface::getMap()->getWidth();
int total_height = MapInterface::getMap()->getHeight();
Surface unpacked(total_width, total_height, 1);

SDL_Surface *surf = SDL_CreateRGBSurfaceFrom(unpacked.getFrame0(),
                                              unpacked.getWidth(),
                                             unpacked.getHeight(),
                                             8,
                                             unpacked.getPitch(), // pitch
                                             0,0,0,0);


if ( ! surf )
{
    printf("surface is null!");
}

Load our palette and tell SDL about it:

Palette::loadACT(palettefile);
SDL_SetColors(surf, Palette::color, 0, 256);

Now we can clear our packed surface and write the tiles:

unpacked.fill(0);
for (int x = 0; x < MapInterface::getMap()->getWidth(); x++) {
    for (int y = 0; y < MapInterface::getMap()->getHeight(); y++) {
//        pak.setFrame(n);
        blitTile(unpacked, MapInterface::getMap()->getValue(x, y), x + 32, y + 32);
    }
}

The blitTile function was not easily accessible, as I could not get enough of the project to compile as the time to use it. Luckily we can just copy it into our script:

void blitTile(Surface &dest, unsigned short tile, int x, int y)
{
    PIX * tileptr = TileInterface::getTileSet()->getTile(tile);

    int lines = 32;
    int columns = 32;

    if ( y < 0 )
    {
        lines = 32 + y;
        tileptr += ((32-lines)*32);
        y = 0;
    }

    if ( x < 0 )
    {
        columns = 32 + x;
        tileptr += (32-columns); // advance the unseen pixels
        x = 0;
    }

    PIX * destptr = dest.getFrame0();
    destptr += (y * dest.getPitch()) + x;


    if ( y + 32 > (int)dest.getHeight() )
    {
        lines = (int)dest.getHeight() - y;
    }

    if ( x + 32 > (int)dest.getWidth())
    {
        columns = (int)dest.getWidth() - x;
    }

    PIX * endptr = destptr + (lines * dest.getPitch());

    for ( /* nothing */ ; destptr < endptr; destptr += dest.getPitch())
    {
        memcpy(destptr,tileptr,columns);
        tileptr +=32;
    }

}

This is quite a fun piece of code because it uses pointer arithmetic. Instead of working with an array, we simply get an address of memory and offset the address as we copy the memory to our surface based on the "pitch" of bytes in the format, which is number of bytes in between "rows". The array syntax in C is just sugar for doing this (why we don't use the sugar I don't know).

This is the final version of the code. It took a few iterations to get it right:

Our second attempt, a very blurry map:

Then a higher quality map that is obviously messed up:

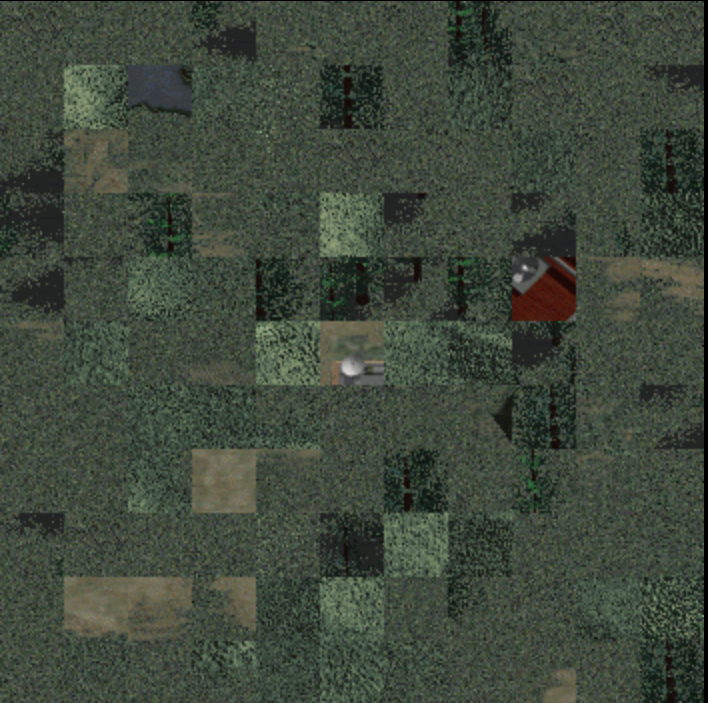
... and finally! The resulting image is uncompressed 11k x 11k pixels. It's 121 megabytes as a BMP file, or 47mb as a webp with no percieved loss of quality.

Click to enlarge.

Conclusion

I'll be happy to see a new community form around the game if we can add map creation and improve the hosting story around the server, and maybe some central stats/prestige tracking.

It's neat to see what they did to compress the assets, whereas today we might just end up with a "tiny" 1GB game on steam. :)

Thu Apr 02 2020

Just How Fast is EJS?

Article size is 20.5 kB and is a 13 min read

With one project most of our server-side rendered pages are served using the EJS ExpressJS plugin. Since we're using NodeJS this makes sense for us. EJS is fast, and easy to write. The amount of abstraction is also low since the library is fairly small, and I think everyone knows how big of a fan I am of the right (and less) abstractions.

For this project, EJS works well for the marketing site and administration app with pages being able to be rendered in single-digit milliseconds. But what about the really heavily hit stuff - the embedded widgets this project serves?

Quick Background - How The Embedded Widgets Work

For the embedded widgets, a script is loaded, which injects a styled and dynamically resized iframe into the page.

The script (#1) is needed to control the iframe - its styling, the auto resizing, etc.

The /embed endpoint (#2) loads our iframe content.

So what we're talking about here is #2.

Just cache it dude

The problem with caching in this scenario is when items fall out of the cache. For this project we don't want to risk the 1% percentile latency being bad. So that /embed endpoint should always be fast.

So let's benchmark.

Benchmark - Template Literal

First let's get a baseline. Let's compare EJS to the fastest thing we can - returning a string. No caching, although in production currently we use an LRU cache.

What if the endpoint was just a string literal?

We'll use autocannon with the default settings to run our test, using and endpoint with actual parameters taken from production.

┌─────────┬──────┬──────┬───────┬──────┬─────────┬─────────┬─────────┐ │ Stat │ 2.5% │ 50% │ 97.5% │ 99% │ Avg │ Stdev │ Max │ ├─────────┼──────┼──────┼───────┼──────┼─────────┼─────────┼─────────┤ │ Latency │ 2 ms │ 2 ms │ 4 ms │ 5 ms │ 2.25 ms │ 0.69 ms │ 15.7 ms │ └─────────┴──────┴──────┴───────┴──────┴─────────┴─────────┴─────────┘ ┌───────────┬─────────┬─────────┬────────┬─────────┬─────────┬────────┬─────────┐ │ Stat │ 1% │ 2.5% │ 50% │ 97.5% │ Avg │ Stdev │ Min │ ├───────────┼─────────┼─────────┼────────┼─────────┼─────────┼────────┼─────────┤ │ Req/Sec │ 2175 │ 2175 │ 3869 │ 4001 │ 3631 │ 555.19 │ 2174 │ ├───────────┼─────────┼─────────┼────────┼─────────┼─────────┼────────┼─────────┤ │ Bytes/Sec │ 3.54 MB │ 3.54 MB │ 6.3 MB │ 6.52 MB │ 5.91 MB │ 904 kB │ 3.54 MB │ └───────────┴─────────┴─────────┴────────┴─────────┴─────────┴────────┴─────────┘ Req/Bytes counts sampled once per second. 36k requests in 10.08s, 59.1 MB read
┌─────────┬──────┬──────┬───────┬──────┬─────────┬─────────┬──────────┐ │ Stat │ 2.5% │ 50% │ 97.5% │ 99% │ Avg │ Stdev │ Max │ ├─────────┼──────┼──────┼───────┼──────┼─────────┼─────────┼──────────┤ │ Latency │ 2 ms │ 2 ms │ 3 ms │ 3 ms │ 2.08 ms │ 0.31 ms │ 10.98 ms │ └─────────┴──────┴──────┴───────┴──────┴─────────┴─────────┴──────────┘ ┌───────────┬─────────┬─────────┬─────────┬─────────┬─────────┬────────┬─────────┐ │ Stat │ 1% │ 2.5% │ 50% │ 97.5% │ Avg │ Stdev │ Min │ ├───────────┼─────────┼─────────┼─────────┼─────────┼─────────┼────────┼─────────┤ │ Req/Sec │ 3755 │ 3755 │ 3945 │ 4015 │ 3920.82 │ 79.38 │ 3755 │ ├───────────┼─────────┼─────────┼─────────┼─────────┼─────────┼────────┼─────────┤ │ Bytes/Sec │ 6.12 MB │ 6.12 MB │ 6.43 MB │ 6.54 MB │ 6.39 MB │ 129 kB │ 6.12 MB │ └───────────┴─────────┴─────────┴─────────┴─────────┴─────────┴────────┴─────────┘ Req/Bytes counts sampled once per second. 43k requests in 11.08s, 70.2 MB read
┌─────────┬──────┬──────┬───────┬──────┬─────────┬─────────┬──────────┐ │ Stat │ 2.5% │ 50% │ 97.5% │ 99% │ Avg │ Stdev │ Max │ ├─────────┼──────┼──────┼───────┼──────┼─────────┼─────────┼──────────┤ │ Latency │ 2 ms │ 2 ms │ 3 ms │ 3 ms │ 2.06 ms │ 0.28 ms │ 11.24 ms │ └─────────┴──────┴──────┴───────┴──────┴─────────┴─────────┴──────────┘ ┌───────────┬─────────┬─────────┬─────────┬─────────┬─────────┬─────────┬─────────┐ │ Stat │ 1% │ 2.5% │ 50% │ 97.5% │ Avg │ Stdev │ Min │ ├───────────┼─────────┼─────────┼─────────┼─────────┼─────────┼─────────┼─────────┤ │ Req/Sec │ 3887 │ 3887 │ 3965 │ 4033 │ 3969.73 │ 41.4 │ 3887 │ ├───────────┼─────────┼─────────┼─────────┼─────────┼─────────┼─────────┼─────────┤ │ Bytes/Sec │ 6.33 MB │ 6.33 MB │ 6.46 MB │ 6.57 MB │ 6.47 MB │ 66.9 kB │ 6.33 MB │ └───────────┴─────────┴─────────┴─────────┴─────────┴─────────┴─────────┴─────────┘ Req/Bytes counts sampled once per second. 44k requests in 11.08s, 71.1 MB read

You can see it gets faster each time as we make Turbofan happy and the JIT kicks in.

We can see that after JIT compilation our max latency is 11.24ms with the lowest requests/second over ten seconds being 3887.

On kind of unrelated tangent, I wanted to show something real quick. Logging in NodeJS is slow, even with the best of frameworks. How slow?

Well, using connect w/ log4js, logging a line like this with each request:

[2020-04-02T00:04:05.642] [DEBUG] express - ::1 - - "GET /embed?config=%7B%22tenantId%22%3A%22DTGXwVKr%22%2C%22apiHost%22%3A%22http%253A%252F%252Flocalhost%253A3001%22%2C%22urlId%22%3A%22http%253A%252F%252Flocalhost%253A63342%252Fwatchly-models%252Fscripts%252Flocal-test-lifetime.html%253F_ijt%253Dlh9s0h0fgv1t2n2ceibdot1c1g%22%7D HTTP/1.1" 200 1065 "http://localhost:63342/watchly-models/scripts/local-test-lifetime.html?_ijt=lh9s0h0fgv1t2n2ceibdot1c1g" "Mozilla/5.0 (Windows NT 10.0; Win64; x64) AppleWebKit/537.36 (KHTML, like Gecko) Chrome/80.0.3987.149 Safari/537.36"

It has an impact - surprisingly. So let's disable logging for a second.

I ran it twice, here's the second run.

┌─────────┬──────┬──────┬───────┬──────┬─────────┬─────────┬──────────┐ │ Stat │ 2.5% │ 50% │ 97.5% │ 99% │ Avg │ Stdev │ Max │ ├─────────┼──────┼──────┼───────┼──────┼─────────┼─────────┼──────────┤ │ Latency │ 1 ms │ 1 ms │ 2 ms │ 3 ms │ 1.15 ms │ 0.44 ms │ 13.68 ms │ └─────────┴──────┴──────┴───────┴──────┴─────────┴─────────┴──────────┘ ┌───────────┬─────────┬─────────┬─────────┬─────────┬─────────┬────────┬─────────┐ │ Stat │ 1% │ 2.5% │ 50% │ 97.5% │ Avg │ Stdev │ Min │ ├───────────┼─────────┼─────────┼─────────┼─────────┼─────────┼────────┼─────────┤ │ Req/Sec │ 5051 │ 5051 │ 5467 │ 5623 │ 5429.28 │ 172.67 │ 5049 │ ├───────────┼─────────┼─────────┼─────────┼─────────┼─────────┼────────┼─────────┤ │ Bytes/Sec │ 7.78 MB │ 7.78 MB │ 8.42 MB │ 8.67 MB │ 8.36 MB │ 266 kB │ 7.78 MB │ └───────────┴─────────┴─────────┴─────────┴─────────┴─────────┴────────┴─────────┘ Req/Bytes counts sampled once per second. 60k requests in 11.08s, 92 MB read

Wow! Our max latency isn't much better, but our average is cut in half, and we go from 44k requests/second to 60.

Of course, Node has to take a lock to write to stdout since you'll have many workers writing logs, you don't want one log to be half written into another one. So we have a concurrency bottleneck with logging every request even if you have many workers.

Note that the impact is so profound just because what we're testing is so light, but it can build up. Generally "aggregated logging" or batched logs sent over the network are better for performance focused systems.

Benchmark - EJS

┌─────────┬──────┬──────┬───────┬──────┬────────┬─────────┬──────────┐ │ Stat │ 2.5% │ 50% │ 97.5% │ 99% │ Avg │ Stdev │ Max │ ├─────────┼──────┼──────┼───────┼──────┼────────┼─────────┼──────────┤ │ Latency │ 4 ms │ 4 ms │ 7 ms │ 8 ms │ 4.4 ms │ 0.94 ms │ 19.83 ms │ └─────────┴──────┴──────┴───────┴──────┴────────┴─────────┴──────────┘ ┌───────────┬─────────┬─────────┬─────────┬────────┬─────────┬────────┬─────────┐ │ Stat │ 1% │ 2.5% │ 50% │ 97.5% │ Avg │ Stdev │ Min │ ├───────────┼─────────┼─────────┼─────────┼────────┼─────────┼────────┼─────────┤ │ Req/Sec │ 1327 │ 1327 │ 2223 │ 2269 │ 2072.73 │ 286.91 │ 1327 │ ├───────────┼─────────┼─────────┼─────────┼────────┼─────────┼────────┼─────────┤ │ Bytes/Sec │ 1.81 MB │ 1.81 MB │ 3.03 MB │ 3.1 MB │ 2.83 MB │ 391 kB │ 1.81 MB │ └───────────┴─────────┴─────────┴─────────┴────────┴─────────┴────────┴─────────┘ Req/Bytes counts sampled once per second. 23k requests in 11.08s, 31.1 MB read
┌─────────┬──────┬──────┬───────┬──────┬─────────┬─────────┬──────────┐ │ Stat │ 2.5% │ 50% │ 97.5% │ 99% │ Avg │ Stdev │ Max │ ├─────────┼──────┼──────┼───────┼──────┼─────────┼─────────┼──────────┤ │ Latency │ 4 ms │ 4 ms │ 5 ms │ 5 ms │ 4.11 ms │ 0.37 ms │ 12.36 ms │ └─────────┴──────┴──────┴───────┴──────┴─────────┴─────────┴──────────┘ ┌───────────┬─────────┬─────────┬─────────┬─────────┬─────────┬─────────┬─────────┐ │ Stat │ 1% │ 2.5% │ 50% │ 97.5% │ Avg │ Stdev │ Min │ ├───────────┼─────────┼─────────┼─────────┼─────────┼─────────┼─────────┼─────────┤ │ Req/Sec │ 2079 │ 2079 │ 2225 │ 2259 │ 2201.73 │ 57.87 │ 2078 │ ├───────────┼─────────┼─────────┼─────────┼─────────┼─────────┼─────────┼─────────┤ │ Bytes/Sec │ 2.83 MB │ 2.83 MB │ 3.04 MB │ 3.08 MB │ 3 MB │ 79.2 kB │ 2.83 MB │ └───────────┴─────────┴─────────┴─────────┴─────────┴─────────┴─────────┴─────────┘ Req/Bytes counts sampled once per second. 24k requests in 11.08s, 33 MB read
┌─────────┬──────┬──────┬───────┬──────┬─────────┬─────────┬──────────┐ │ Stat │ 2.5% │ 50% │ 97.5% │ 99% │ Avg │ Stdev │ Max │ ├─────────┼──────┼──────┼───────┼──────┼─────────┼─────────┼──────────┤ │ Latency │ 4 ms │ 4 ms │ 5 ms │ 5 ms │ 4.07 ms │ 0.31 ms │ 13.22 ms │ └─────────┴──────┴──────┴───────┴──────┴─────────┴─────────┴──────────┘ ┌───────────┬─────────┬─────────┬─────────┬────────┬─────────┬─────────┬─────────┐ │ Stat │ 1% │ 2.5% │ 50% │ 97.5% │ Avg │ Stdev │ Min │ ├───────────┼─────────┼─────────┼─────────┼────────┼─────────┼─────────┼─────────┤ │ Req/Sec │ 2173 │ 2173 │ 2239 │ 2271 │ 2240.6 │ 28.83 │ 2173 │ ├───────────┼─────────┼─────────┼─────────┼────────┼─────────┼─────────┼─────────┤ │ Bytes/Sec │ 2.97 MB │ 2.97 MB │ 3.05 MB │ 3.1 MB │ 3.06 MB │ 38.9 kB │ 2.96 MB │ └───────────┴─────────┴─────────┴─────────┴────────┴─────────┴─────────┴─────────┘ Req/Bytes counts sampled once per second. 22k requests in 10.07s, 30.6 MB read

Wow, a huge difference. We can only serve half the requests in the same amount of time and latency is doubled across the board.

Again remember - it may seem crazy to optimize this. But for the nature of this project - a widget hosted on a third party page - can mean that we get flooded with tons of requests for uncached pages at once. Even with autoscaling this could cause an outage or at least a hiccup. Being able to handle twice the uncached traffic in a spike is a big deal.

So let's take a step back. What if we also add an LRU cache to our template literal?

First it starts off not so great, since the JIT hasn't warmed up yet.

┌─────────┬──────┬──────┬───────┬──────┬─────────┬─────────┬──────────┐ │ Stat │ 2.5% │ 50% │ 97.5% │ 99% │ Avg │ Stdev │ Max │ ├─────────┼──────┼──────┼───────┼──────┼─────────┼─────────┼──────────┤ │ Latency │ 2 ms │ 2 ms │ 4 ms │ 5 ms │ 2.24 ms │ 0.72 ms │ 24.13 ms │ └─────────┴──────┴──────┴───────┴──────┴─────────┴─────────┴──────────┘ ┌───────────┬────────┬────────┬─────────┬─────────┬─────────┬────────┬─────────┐ │ Stat │ 1% │ 2.5% │ 50% │ 97.5% │ Avg │ Stdev │ Min │ ├───────────┼────────┼────────┼─────────┼─────────┼─────────┼────────┼─────────┤ │ Req/Sec │ 2145 │ 2145 │ 3897 │ 4087 │ 3659 │ 546.44 │ 2145 │ ├───────────┼────────┼────────┼─────────┼─────────┼─────────┼────────┼─────────┤ │ Bytes/Sec │ 3.5 MB │ 3.5 MB │ 6.35 MB │ 6.66 MB │ 5.96 MB │ 890 kB │ 3.49 MB │ └───────────┴────────┴────────┴─────────┴─────────┴─────────┴────────┴─────────┘ Req/Bytes counts sampled once per second. 40k requests in 11.07s, 65.6 MB read

But then!

┌─────────┬──────┬──────┬───────┬──────┬─────────┬────────┬──────────┐ │ Stat │ 2.5% │ 50% │ 97.5% │ 99% │ Avg │ Stdev │ Max │ ├─────────┼──────┼──────┼───────┼──────┼─────────┼────────┼──────────┤ │ Latency │ 2 ms │ 2 ms │ 3 ms │ 3 ms │ 2.06 ms │ 0.3 ms │ 11.41 ms │ └─────────┴──────┴──────┴───────┴──────┴─────────┴────────┴──────────┘ ┌───────────┬─────────┬─────────┬─────────┬─────────┬─────────┬─────────┬─────────┐ │ Stat │ 1% │ 2.5% │ 50% │ 97.5% │ Avg │ Stdev │ Min │ ├───────────┼─────────┼─────────┼─────────┼─────────┼─────────┼─────────┼─────────┤ │ Req/Sec │ 3849 │ 3849 │ 3967 │ 4037 │ 3970.8 │ 53.39 │ 3848 │ ├───────────┼─────────┼─────────┼─────────┼─────────┼─────────┼─────────┼─────────┤ │ Bytes/Sec │ 6.27 MB │ 6.27 MB │ 6.46 MB │ 6.58 MB │ 6.47 MB │ 86.9 kB │ 6.27 MB │ └───────────┴─────────┴─────────┴─────────┴─────────┴─────────┴─────────┴─────────┘ Req/Bytes counts sampled once per second. 40k requests in 10.08s, 64.7 MB read

Wait, isn't that the same as our string literal test? Let's check again.

┌─────────┬──────┬──────┬───────┬──────┬─────────┬─────────┬──────────┐ │ Stat │ 2.5% │ 50% │ 97.5% │ 99% │ Avg │ Stdev │ Max │ ├─────────┼──────┼──────┼───────┼──────┼─────────┼─────────┼──────────┤ │ Latency │ 2 ms │ 2 ms │ 3 ms │ 3 ms │ 2.08 ms │ 0.36 ms │ 11.58 ms │ └─────────┴──────┴──────┴───────┴──────┴─────────┴─────────┴──────────┘ ┌───────────┬────────┬────────┬─────────┬─────────┬─────────┬────────┬────────┐ │ Stat │ 1% │ 2.5% │ 50% │ 97.5% │ Avg │ Stdev │ Min │ ├───────────┼────────┼────────┼─────────┼─────────┼─────────┼────────┼────────┤ │ Req/Sec │ 3699 │ 3699 │ 3975 │ 4051 │ 3932.28 │ 96.96 │ 3699 │ ├───────────┼────────┼────────┼─────────┼─────────┼─────────┼────────┼────────┤ │ Bytes/Sec │ 5.7 MB │ 5.7 MB │ 6.13 MB │ 6.25 MB │ 6.06 MB │ 150 kB │ 5.7 MB │ └───────────┴────────┴────────┴─────────┴─────────┴─────────┴────────┴────────┘ Req/Bytes counts sampled once per second. 43k requests in 11.08s, 66.6 MB read

Yup. Just res.send(${some} stuff) is faster than checking if an item is in the cache and sending it back in the case of our micro benchmark.

Just for giggles, what if we just used a regular map for the cache instead of this fancy lru cache?

┌─────────┬──────┬──────┬───────┬──────┬─────────┬────────┬──────────┐ │ Stat │ 2.5% │ 50% │ 97.5% │ 99% │ Avg │ Stdev │ Max │ ├─────────┼──────┼──────┼───────┼──────┼─────────┼────────┼──────────┤ │ Latency │ 2 ms │ 2 ms │ 3 ms │ 3 ms │ 2.06 ms │ 0.3 ms │ 11.84 ms │ └─────────┴──────┴──────┴───────┴──────┴─────────┴────────┴──────────┘ ┌───────────┬─────────┬─────────┬─────────┬────────┬─────────┬─────────┬─────────┐ │ Stat │ 1% │ 2.5% │ 50% │ 97.5% │ Avg │ Stdev │ Min │ ├───────────┼─────────┼─────────┼─────────┼────────┼─────────┼─────────┼─────────┤ │ Req/Sec │ 3779 │ 3779 │ 3977 │ 4023 │ 3961.73 │ 62.58 │ 3779 │ ├───────────┼─────────┼─────────┼─────────┼────────┼─────────┼─────────┼─────────┤ │ Bytes/Sec │ 5.82 MB │ 5.82 MB │ 6.13 MB │ 6.2 MB │ 6.1 MB │ 96.6 kB │ 5.82 MB │ └───────────┴─────────┴─────────┴─────────┴────────┴─────────┴─────────┴─────────┘ Req/Bytes counts sampled once per second. 44k requests in 11.08s, 67.1 MB read

At this point what we are seeing is that most of the time is not spent actually constructing the value, but to actually enqueue it into the event loop and send it over the wire.

So where do we go from here? Well, aside from making major architecture changes, let's revisit that logging thing. What if we disable logging for just that route? It's not a big deal - we have the logs in Nginx.

┌─────────┬──────┬──────┬───────┬──────┬─────────┬─────────┬──────────┐ │ Stat │ 2.5% │ 50% │ 97.5% │ 99% │ Avg │ Stdev │ Max │ ├─────────┼──────┼──────┼───────┼──────┼─────────┼─────────┼──────────┤ │ Latency │ 0 ms │ 1 ms │ 1 ms │ 1 ms │ 0.69 ms │ 0.49 ms │ 11.32 ms │ └─────────┴──────┴──────┴───────┴──────┴─────────┴─────────┴──────────┘ ┌───────────┬───────┬───────┬─────────┬─────────┬─────────┬────────┬───────┐ │ Stat │ 1% │ 2.5% │ 50% │ 97.5% │ Avg │ Stdev │ Min │ ├───────────┼───────┼───────┼─────────┼─────────┼─────────┼────────┼───────┤ │ Req/Sec │ 9103 │ 9103 │ 9447 │ 9663 │ 9438.91 │ 147.37 │ 9102 │ ├───────────┼───────┼───────┼─────────┼─────────┼─────────┼────────┼───────┤ │ Bytes/Sec │ 14 MB │ 14 MB │ 14.6 MB │ 14.9 MB │ 14.5 MB │ 227 kB │ 14 MB │ └───────────┴───────┴───────┴─────────┴─────────┴─────────┴────────┴───────┘ Req/Bytes counts sampled once per second. 104k requests in 11.09s, 160 MB read

Wow! Double the requests, half the average latency. But why? I originally thought the reason is that this request has a giant query string that gets logged. Observe - if we remove that config from the query string and keep the request logs:

┌─────────┬──────┬──────┬───────┬──────┬─────────┬─────────┬──────────┐ │ Stat │ 2.5% │ 50% │ 97.5% │ 99% │ Avg │ Stdev │ Max │ ├─────────┼──────┼──────┼───────┼──────┼─────────┼─────────┼──────────┤ │ Latency │ 2 ms │ 2 ms │ 3 ms │ 3 ms │ 2.04 ms │ 0.25 ms │ 11.12 ms │ └─────────┴──────┴──────┴───────┴──────┴─────────┴─────────┴──────────┘ ┌───────────┬─────────┬─────────┬─────────┬─────────┬─────────┬────────┬─────────┐ │ Stat │ 1% │ 2.5% │ 50% │ 97.5% │ Avg │ Stdev │ Min │ ├───────────┼─────────┼─────────┼─────────┼─────────┼─────────┼────────┼─────────┤ │ Req/Sec │ 4035 │ 4035 │ 4347 │ 4423 │ 4324.64 │ 103.49 │ 4034 │ ├───────────┼─────────┼─────────┼─────────┼─────────┼─────────┼────────┼─────────┤ │ Bytes/Sec │ 4.68 MB │ 4.68 MB │ 5.04 MB │ 5.13 MB │ 5.02 MB │ 119 kB │ 4.68 MB │ └───────────┴─────────┴─────────┴─────────┴─────────┴─────────┴────────┴─────────┘ Req/Bytes counts sampled once per second. 48k requests in 11.08s, 55.2 MB read

A little better, but not much! Logging, and express middleware, is just slow.

I think what we are going to do is what bought us the lowest latency - rewriting in Rust! Just kidding. Here:

  1. Be careful caching in NodeJS. Thrashes GC, takes longer to get from cache than to reconstruct string after JIT.
  2. Don't log these requests in the Node layer.
  3. Template literals.
  4. Cache at the proxy layer.
  5. COMMENT YOUR OPTIMIZATIONS

I wouldn't apply these optimizations to other things, but really we're desperate to make sure this project is fast as it can be in certain areas. Engineering is all about trade-offs. Also, be a good developer. If you're going to write code that's tough to deal with, explain why:

worker.use('/embed', require('./routes/embed')); // OPTIMIZATION This is here so we don't log the requests, which is slow. worker.use(express.static(path.join(__dirname, 'public'))); // OPTIMIZATION This is here so we don't log the requests, which is slow. worker.use(log4js.connectLogger(logger, { level: 'debug' }));

Also, interestingly having the express.static router first slows things down by about 30%.

We could also probably get better performance out of optimizing a some code returned by the /embed endpoint, but that's for another day. :)

Mon Feb 17 2020

Efficient Data Structures for MMO Game Back-ends in Java

Article size is 14.4 kB - 18.6 MB and is a 11 min read

... and how I almost rewrote the backend in Rust, but didn't.

Java gurus beware - none of this is new news. However, it is interesting, and I ran into it recently for the first time dealing with large heaps. Most Java applications I've worked on either had data on the heap very short-lived like per-request or the heap allocation was very temporary (like batch processing).

The Context

However, for the past six months I've been working on TDWorld. TDWorld can best be described as a global-scale tower defense MMO. That's a mouthful, but that's what it is. It's a location based game where you claim buildings and connect them. For example, let's say you claim your house and then the supermarket down the street. You connect them, and if your creeps make it from your house to the supermarket you get in-game currency. The game plays on a real map - using real roads and buildings. Your enemies can take a building in between your house and that supermarket, level it up, and stop your creeps from reaching their destination. Hence, the strategy part.

The Problem

We have a few requirements. We need to be able to simulate vehicle traffic, in the form of in-game creeps, and also support queries that allow towers to efficiently find the nearby creeps to attack. On top of this we need to sync state with your phone. It's not a small task.

On top of that, we don't have a lot of money. I started with MapBox for the traffic routing and quickly racked up thousands of dollars in API requests during testing. This was a big no-no, so we now run our own instance of the routing server.

For a quick example, here's a very early version of the client that rendered an android TextureView over MapBox's SurfaceView by using reflection to grab its contents and overwrite it (Android devs will know how dirty of a hack this is). But it lets us demonstrate the game. Don't worry, I'm getting to the technical stuff soon.

Interesting Update
As of 2022 The game is now built in a custom 3D OSRM renderer on top of libgdx. The article continues with the old 2d renderer.

This example is playing the game in Redwood City. Ignore the graphics. Just see how the creeps follow the roads and the towers have to shoot them. Everyone on their phone should see the same thing as you.

TDWorld Example!

This demonstrates the kind of queries we need to support. For this we make heavy use of David Moten's rtree.

That's not so much what this post is about, I can write a separate post about immutable rtrees. This is about reducing memory, because oh man did we have a problem with that.

Interesting Update
As of 2022, we now use a custom grid-based geospacial index, instead of R-trees which proved to be too complicated and too much overhead.

Technical Juicy Stuff

Here are all the problems I had, as of last Friday:

  1. Seeding was super slow. On launch, we want to have NPCs in every major city in the US (before we launch globally) proportional to the population of said city, randomly distributed from the city's center. It took almost 30 minutes to seed this data and build the indexes, which was too slow to iterate and develop on.
  2. Saving and restoring game state was super slow. Like a minute to checkpoint to disk and ten minutes to restore.
  3. We were using way too much memory. For around 300k towers and a few thousand creeps we saw heap sizes of 14gb. This could equal hundreds of gigabytes in the real world - needlessly expensive! Also, the connections themselves will take a lot of memory so can't use all resources just on the game engine.

Efficiency is important here because of scale. A poorly coded backend could mean six months of work wasted if we go down on launch day and nobody comes back to the app - and we don't have the money or time to scale horizontally. So to "get it out there" we need to have a backend that'll scale on one machine, up to a million concurrent connections, and handle tens of millions of actors (creeps) moving around concurrently. For concurrency, we shard in-memory geographically, but I'll cover this in a separate post. If we need to scale horizontally it's just a matter of building an orchestrator to move the shards between instances - and no we can't back this with a traditional database. Millions of concurrent writes with a high write concern basically mean that the app layer needs to have its own in-memory database that checkpoints to disk (and that's what we have). This is also how Redis works!

There was a point where I blamed Java for my poor performance, and I decided a trial rewrite in Rust. I figured I'd just 1:1 port the Java code and see what the performance difference was.

I ported All the structures and then the seeding code. This was a super painful two days, and I am not a Rust fan yet. I think I get Rust, it's just stressful and not so fun to write.

Anyway, the code written in Rust blew away the code in Java. It could seed the data for a thousand cities, and create all the NPC users, in seconds.

Then I realized I had forgotten to pull out my profiler. N00b mistake. A quick dig into JDK Mission Control showed a number of problems.

I had read the hot path in the Java code a hundred times and couldn't see why the seeding was so slow. The code was so trivial in fact I just didn't think of using a profiler. I suppose I thought it was Java's fault because I was fighting the garbage collector for a while, but I should have known better because switching to Shenandoah fixed that.

(By the way, Shenandoah is awesome, we went from many second pauses to never seeing more than a few hundred milliseconds STW pauses even during serialization/check pointing to disk)

So anyway. The profiler. Here is the cause of my first problem, the seeding being slow. During seeding, we enqueue a request to route between the source and target towers - and there can be hundreds of thousands of these requests. The downstream routing server is in C++ but it can still only handle so many requests concurrently, so we queue them up in memory in the game backend using a custom task executor.

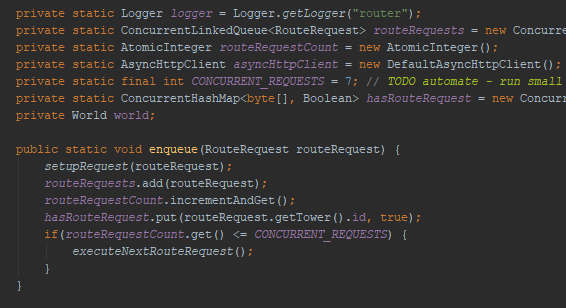
And that executor - uses a ConcurrentLinkedQueue.

Router Class Fields

So what's wrong with that? Well, every time we enqueue a request we check the count of the queued items to see if we should execute that one right away:

Router Class Oopsie

The problem is ConcurrentLinkedQueue is implemented using a linked list. We call size() on it A LOT, and each time it was iterating through the whole queue. I'm not sure why the JDK doesn't optimize this using atomics, as that would probably introduce less contention than what it's doing today. All we had to do was use an AtomicInteger to keep track of the count.

Router Class Fix

So that's #1 solved. The Java version was now faster than Rust.

So now #2

Here's where we talk about data structures, sorry.

Ok - I wrote the title of this and then realized it takes a while to actually get to what the title's about. Thanks for getting this far.

Most of what we need to store in memory is the routing information. Each route - for example between your house and the grocery store - consists of a bunch of steps.

These steps are basically objects with the properties {duration, speed, and lat/lng}. And we store A LOT of these. Whenever a creep is primed to move again, we get the next step and then update its position in the rtree.

We had originally represented geographical position information using doubles. This gives us a very high degree of accuracy - but at a cost!

Before we optimize, let's look at some stats. We can optimize forever, so we have to quantify when we're done. Let's 5gb of heap is where we'd be happy with our testing dataset.

Note that the creep/tower count is just to some info about one shard that I have running, it doesn't mean that much.

Before Optimization:

CREEPS=3934 TOWERS=263278 TICK DURATION=125.0

Size on disk: 2.322gb

Memory: 14gb

Serialization (checkpoint and app startup) Time

To Disk (nvme): 69540ms

From Disk: 10 minutes

Wow! Over a minute to save! That's not too bad, however think about the fact that it's taking that long because it's doing something intensive. The game engine will already check for how many threads are free and pause one of the shards if needed to serialize to disk - however we don't want to do that for a long time.

So first thing's first. double in the JVM world is 8 bytes. Float is 4. Also, we store a lot of Strings but don't really make use of the String class. Let's change everything to float and byte[].

GitHub Changes

Not too bad. Now let's measure what the affect was.

After changing double to float and String to byte[]

CREEPS=2910 TOWERS=263278 DURATION=202.0

Size on disk: 1.49gb

Memory: 12gb

Serialization (checkpoint and app startup) Time

To Disk: 64443ms

From Disk: 9.5 minutes

Alright, we gave up about 10 meters of accuracy (changing geographical coordinate representation) from double to float and got 2gb of ram and minor serialization improvements.

Not great.

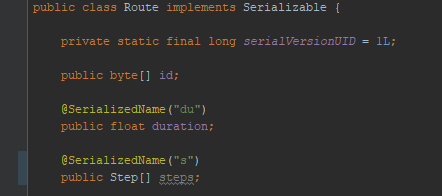
However, one thing I realized was that each Route has many Step[] arrays. Each Step just contains a few floats and a Position object now (which also has two floats).

Route Obj Before Optimization

So basically our route information is a series of floats. Each entry in that Step[] array is also eight bytes for the pointer. That really adds up. Let's get rid of those objects.

Route Obj Using float[]

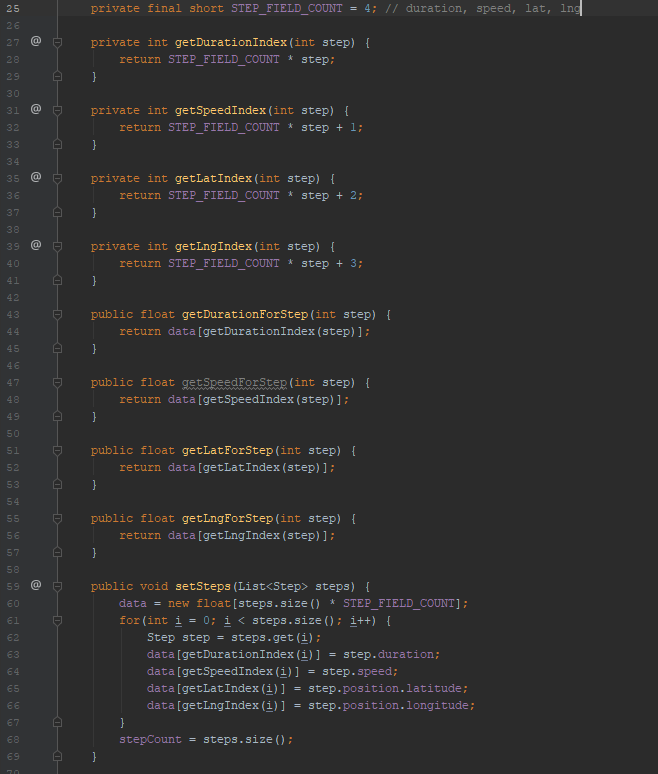
Then we just need some utilities to access this newly formatted data:

Route Obj Utils

So what in the Kotlin is going on here? Well, we're basically serializing our data at rest into an array. This is much more compact than a bunch of objects and is a common tactic for databases written in Java - use primitives as much as possible.

This means that this:

{
  "route": [
    {
      "duration": 2,
      "speed": 5,
      "position": {
        "lat": 76.4,
        "lng": -170
      }
    },
    {
      "duration": 4,
      "speed": 3,
      "position": {
        "lat": 76.2,
        "lng": -170.1
      }
    }
  ]
}

Becomes:

{
  "route": [
    2,
    5,
    76.4,
    -170,
    4,
    3,
    76.2,
    -170.1
  ]
}

Not only is this much nicer for the garbage collection it's much better for serialization in general - and not only to disk but over the network.

You'd think that the JVM is optimizing things like this already, but the best it can do is keep the data the references point to close to each other, and maybe compact the pointers.

The JVM does magical things. But behold.

After redesigning the Route storage

Before Optimizations After
Size on disk 2.322gb 873mb
Memory 14gb 1.8gb
To Disk Time 69540ms 4183ms
From Disk Time 10 minutes 24 seconds

Amazing. Our shard size on disk has gone down from over two gigabytes to 873mb. Note that the app is still running in the background and at 527314 creeps the size on disk is still less than a gigabyte.

Our memory usage went from 14gb to less than two.

Startup time went from ten minutes to 24 seconds, and writing to disk went from over a minute to four seconds.

This was a super productive past couple days, and I'm very happy with the result. I'm hoping that soon we can show off the full game and prepare for launch.

Next I'll be doing a load test with simulating millions of active clients and having the backend continually keep them in sync. This is much harder and will be covered in separate blog posts. Cheers!

Sat Feb 08 2020

Fixng Nginx 502 Gateway Timeout With proxy_pass During Deployments

Article size is 2.6 kB and is a 2 min read

I use Nginx a lot. One issue I've always never been able to figure out is when I use it as a proxy to some backend like Node or Java is that when I restart/redeploy those services Nginx thinks they are down for ~10 seconds.

Recently I realized that Nginx is creating an "upstream" declaration when you use proxy_pass.

View documentation for upstream here.

The thing about ngx_http_upstream_module is that it supports a configuration parameter called fail_timeout. What Nginx uses this for is if the upstream server is not available Nginx won't allow calls to it during this duration. The upstream module allows you to define many backends for a single proxy, meaning you basically create a load balancer.

When you use proxy_pass without explicitly using ngx_http_upstream_module you can think of that as creating a load balancer with only one available node.

So, if you restart your service and Nginx tries to proxy a request to it - and it fails - Nginx will consider that server unavailable for fail_timeout. And since you only have one server in your "load balancer" Nginx can't forward that request to anything. So it returns a 502.

What you can do is set fail_timeout to 0. Then Nginx will never consider the backend unavailable. I'd only do this if you have a single upstream server. Even then it is risky in a high load environment because then if the server becomes overwhelmed it might not have a grace period to recover.

However, if you're in a high load environment I trust you have more than one upstream node :).

So here's what you came for:

upstream backend { server localhost:3001 fail_timeout=0; } server { location / { proxy_pass http://backend; } }

Fri May 17 2019

Pixmap Release: Launching Rewind

Article size is 3.8 kB - 22 MB and is a 3 min read

Today I'm excited to announce a new feature for Pixmap. While I had planned on mostly focusing on the native iOS port in Swift a couple friends brought up an idea that sounded too fun to implement, so here it is.

Pixmap rewind demo

Think version control for pixel art, except it's just linear. It's useful and fun to use. If you buy Pixmap Ultimate you can use rewind to download snapshots or rewind an image.

When you rewind an image it modifies the history like this:

Pixmap rewind how it works

How it works is pretty simple. Luckily we chose to store every change everyone makes which made this possible. When you start a rewind the application simply paginates the event history from the backend and when you rewind an image we use the same architecture for drawing. All the changes get added to the same queue, processed by the same servers, etc. The only real difference is that a lock is created on the image and then released once the rewind is done so that no editing can happen during the rewind.

The main challenge client side was performance.

If you drag the bar all the way to the beginning of time and start dragging it forward that is very "light" since each "tick" of the bar is simply applying changes to the scene from the last tick. However, when you drag backwards you have to re-render the whole scene from the beginning of time to where the user dragged the bar. Doing this on the UI thread resulted in lots of lag, so I had to implement an "observer" thread that waits for things to render, does the processing, and pushes the result to the UI thread. I also ended up changing how concurrency worked in the renderer to reduce CPU usage, making both rewind and drawing smoother.

There were three challenges server side.

The first was that since I'm using websockets the original plan was for the client to send an event and then the server would paginate through the data and send the pages to the client. This didn't work with websockets because no matter the frame size or delay between messages the connection could get clogged resulting in high memory server side, delay in WS handshakes, and ultimately the connection closing. The solution was to implement traditional pagination over websockets where the client says "give me the next 10k after this id". At that point you don't even need websockets but I already have the infrastructure for it for other features.

For sorting the change list server-side for pagination we follow a "start after this _id" approach Mongo's ids are naturally sortable in a non-sharded environment (assuming you let the DB create the id, and you don't create it application side). This drops cpu usage from around 80% during a rewind of "Mid Peninsula" to a negligible amount. Also, we can just use the default index for _id instead of having to create more indexes which would take disk space etc. The only downside is we have to scan some documents before the sort, but at current draw volume this works fine.

Anyway, I had fun building it and hope people enjoy it. Cheers.

Sun May 05 2019

What is winrickLabs?

Article size is 640 B and is a 1 min read

winrickLabs is a place for executing ambitious ideas. Things that may be deemed "too hard" or "not profitable" or "too fun" end up here. This doesn't mean elegant solutions are rejected. In fact, they are encouraged. But the end product should be something to be proud of and the journey should have a story worth telling.

Sun May 05 2019

How does this blog work?

Article size is 1.3 kB - 8.39 kB and is a 1 min read

For those curious, I decided against having this blog be dynamically generated at runtime (think Wordpress, Pico, etc). It really didn't need to be interactive, doesn't need any client side javascript, and really doesn't even need a database. However, writing HTML manually for each post is a pain to maintain and not worth my time.

So to get the best of both worlds - maintainability and simplicity - I do dynamically generate the blog but only at build time.

What this means that I write the posts in Markdown and check them into github in the same repo. The repository contains a NodeJS app and when a GitHub event fires to the build server the build server runs the NodeJS app just one time which generates the site. Then it just sends the build result off to the appropriate server running nginx.

Blog diagram